Solved
Dashboard Design Mode "Artifact" panel is blue so do not see the artifact selected in the right pane
See the TWO screenshots below, the first is bad and the second is good.
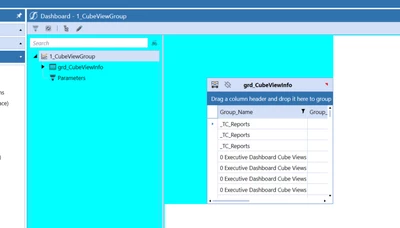
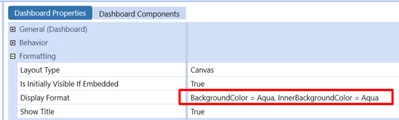
In dashboard design mode on some dashboards, what is causing the left panel to be blue? This is the vertical panel that shows all the artifacts in the dashboard. This is preventing us from seeing which artifact is being selected in the right panel.
In this screenshot the "PDO To Update" label is selected in the right panel but the artifact is not highlighted in the left panel. This makes troubleshooting much more difficult.
 This is bad
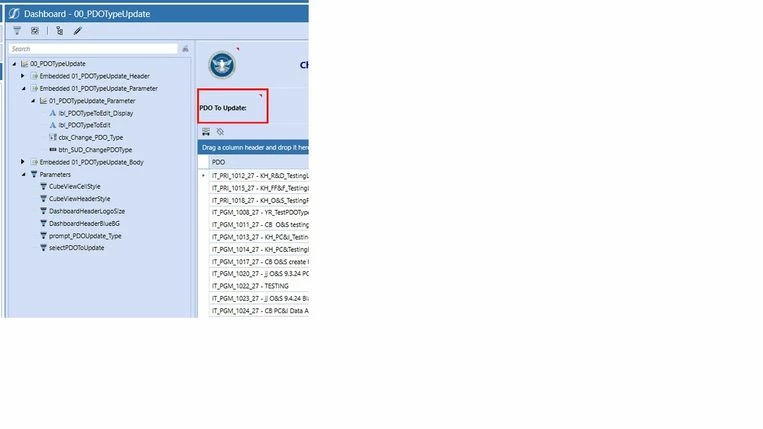
In this screenshot, the "Create New PDO" label is selected in the right panel and we can see the artifact hightlighted in the left panel because the left panel is not blue.
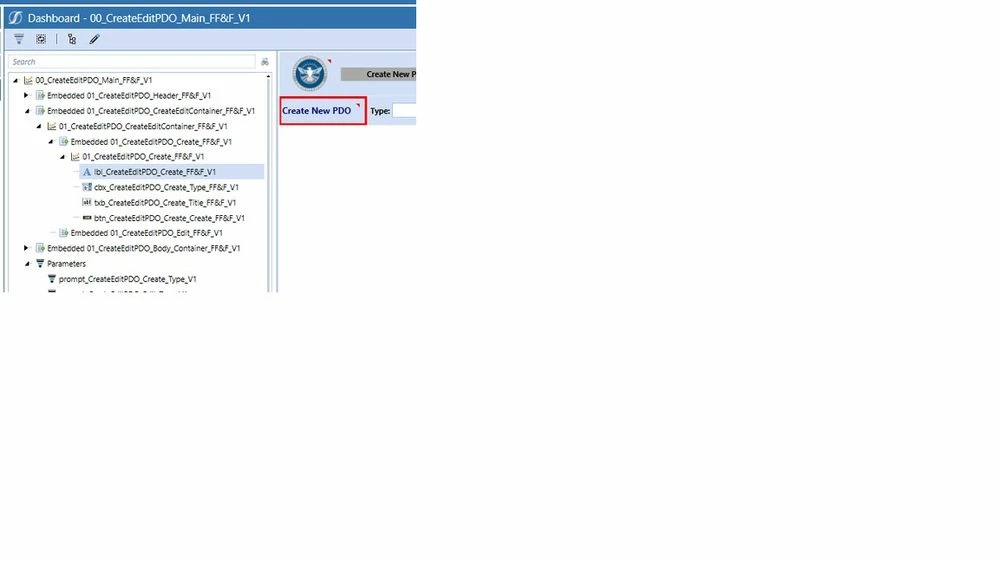 This is good