Drill down Chart in BI Viewer.
Hi
I have a problem with dril Down in BI Viewer.
Part of our UD1 is as follows:
|
BU1000 - EGMONT GROUP |
||||||
|
BU1500 - Other Business line |
||||||
|
|
|
|
|
|
||
|
BU6000 - HOLDING AND SERVICE |
||||||
|
BU6100 - HOLDING COMPANIES |
||||||
I have done the following:
1: Cubeview
Cubeview exportet to excel gives this
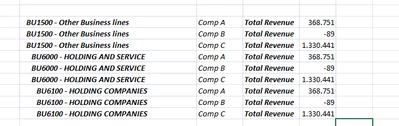
Please notice that top level BU1500 do not aggregate the data. And this is correct, totally 1.7.
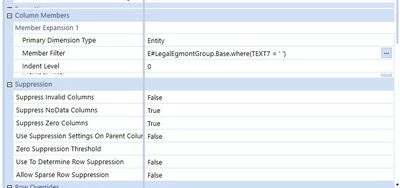
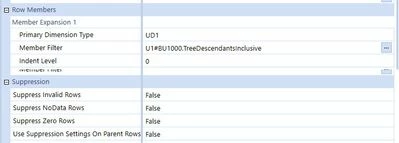
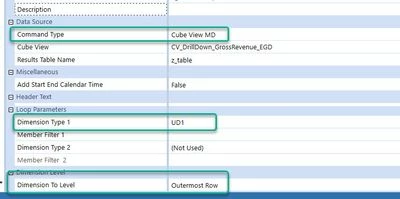
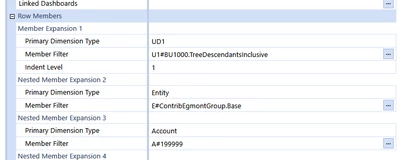
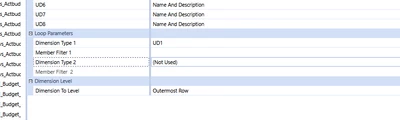
2: Dataadapter:
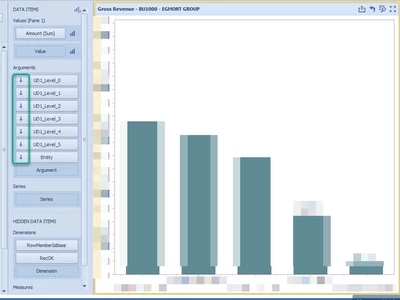
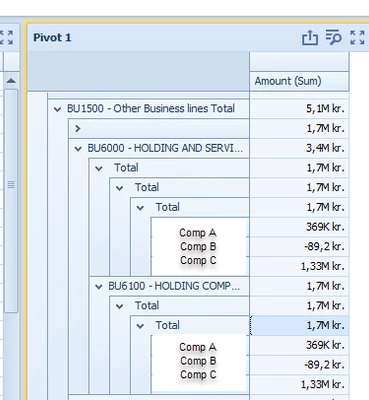
Pivot in BI Viewer looks like this:
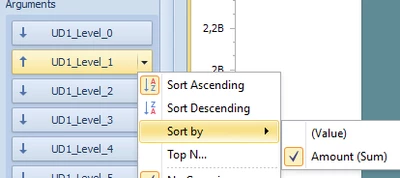
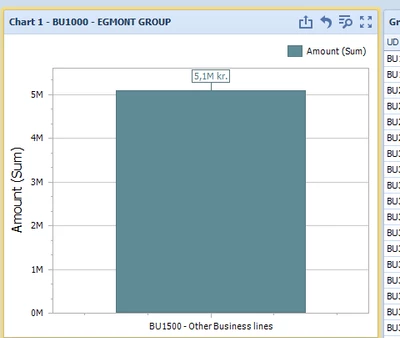
My drill down in Charts i BI viewer looks as follows:
Start: Total 5.1
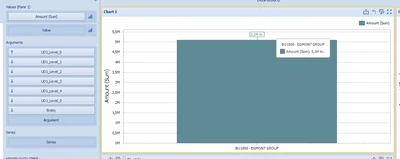
Drill first level: Total 5.1
Drill second level: Total 3.4
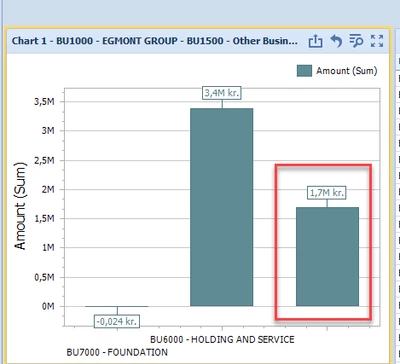
The red box should not be there
Drill third level: Total 1.7
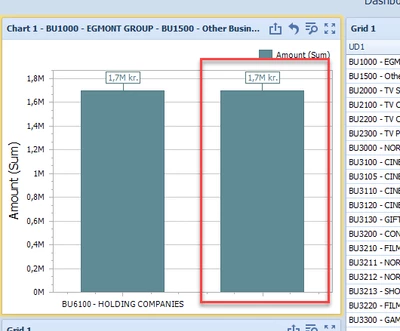
The red box should not be there
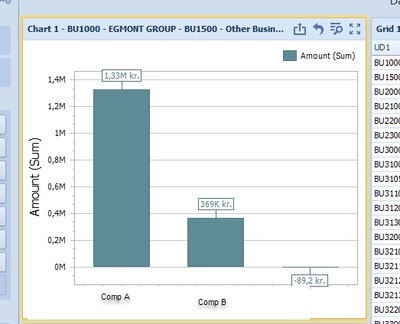
Drill forth level: Entity level (sums up to 1.7)
My questions are as follows, hopefully answering one solves all…
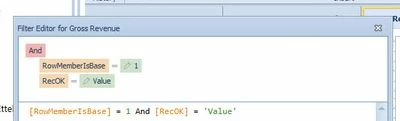
1: I can see in the pivot tablet has the amounts three times. (1.7+1.7+1.7=5.1) where it should be 1.7. This is also giving errors in the charts. How can I avoid this?
2: In the charts I have some ”Ghost” totals as they have one bar for the specification and one bar as a total. How can I avoid this. (the red markings)
3: If a subdivision has 5 sub-subdivisions then entity specifications is 5 click. If another subdivision only has 3 sub-subdivisions, the I still need to click 5 times. Any way to avoid this. (Yes this is icing on the cake)